

Is Austin a Buyers’ Market in 2025? Zip Codes Like 78701 Say Yes
Published | Posted by Dan Price
Is Austin a Buyers’ Market in 2025? Zip Codes Like 78701 Say Yes
Is Austin a buyers’ market in 2025? It’s a question that doesn’t have a one-size-fits-all answer—it depends on where you’re looking. A detailed report from Team Price Real Estate, dated April 10, 2025, breaks down 75 zip codes in the Austin area, showing how market conditions shift from city to city and even neighborhood to neighborhood within Austin itself. The key metric here is "Months of Inventory" (MOI), which measures how long it would take to sell all current homes if no new ones were listed. The report sorts these zip codes into sellers’ markets with less than 4.9 months, neutral markets with 5 to 6.9 months, and buyers’ markets with over 7 months. Let’s dive into what this data reveals, especially in zip codes like 78701, 78704, and 78746, where buyers might find some serious opportunities.
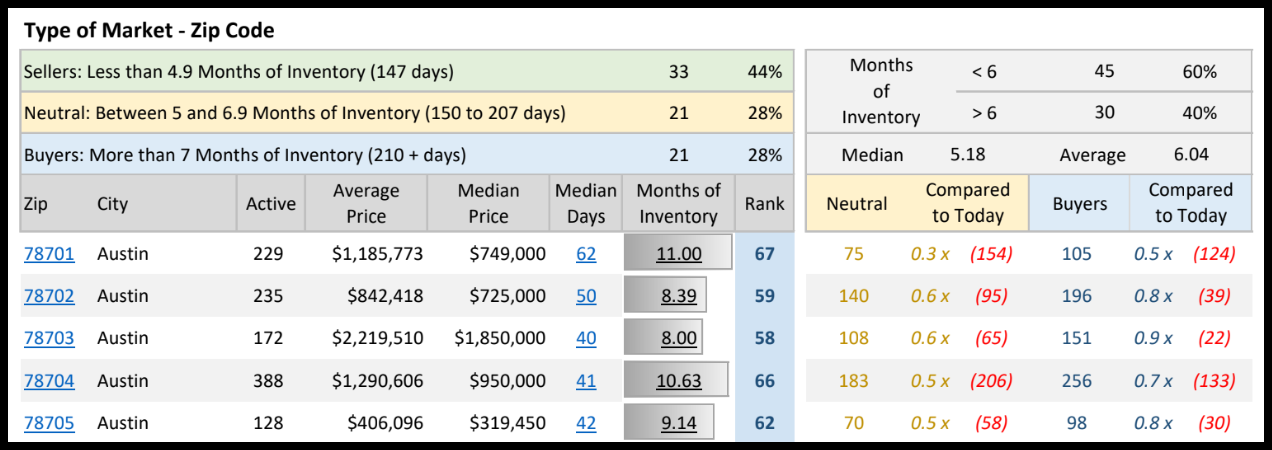
Across all 75 zip codes, the report shows 33 areas, or 44%, are sellers’ markets with less than 4.9 months of inventory. Another 21 zip codes, or 28%, fall into the neutral range with 5 to 6.9 months, while 21 more, also 28%, tip toward buyers with over 7 months. The median MOI is 5.18 months, and the average is 6.04 months, suggesting the Austin area overall is near a balanced market but leans slightly toward buyers. Within Austin’s 42 zip codes (those starting with 787), 12 have an MOI over 7, proving that even inside the city, the market can vary wildly from one spot to the next.
Zip code 78701, smack in downtown Austin, is a clear buyers’ market with an MOI of 11.00 months. It has 229 active listings, averaging $1,185,773 and a median price of $749,000. Homes here sit for a median of 62 days, and 38.4% of listings have dropped prices by an average of $136,000. That’s a sign sellers are feeling the pressure. Just south of downtown, 78704 also favors buyers with an MOI of 10.63 months across 388 listings. Homes average $1,290,606, with a median of $950,000 and 41 days on the market, and 41.5% have cut prices by $106,000 on average. Then there’s 78746, covering ritzy Westlake Hills, with an MOI of 9.43 months and 198 listings. The average price here is a hefty $3,336,813, with a median of $2,554,875, and homes linger for 46 days. About 35.9% of listings have slashed prices by $405,000 on average, showing buyers have leverage in this high-end area.
Other Austin zip codes echo this buyers’ market trend. In 78702, East Austin, the MOI is 8.39 months with 235 listings, averaging $842,418 and a median of $725,000. Homes stay on the market for 50 days, and 50.6% have dropped by $64,000 on average. Zip code 78741, near Riverside, hits an MOI of 11.00 months with 106 listings, averaging $571,587 and a median of $399,995. Here, 52.8% of listings have cut prices by $52,000 after 43 days. These numbers paint a picture of neighborhoods where inventory is piling up, giving buyers more options and bargaining power, especially compared to tighter markets elsewhere in the city.
Outside Austin, the diversity continues. In 78669 (Spicewood), the MOI is 11.00 months with 247 listings, averaging $1,341,771 and a median of $949,000. Homes sit for 62 days, and 44.5% have dropped by $97,000 on average. Similarly, 78645 (Lago Vista) shows an MOI of 11.00 months with 367 listings, averaging $736,502 and a median of $549,900, with 52.6% of listings cutting prices by $68,000 after 69 days. But flip to zip codes like 78727 in North Austin, where the MOI is just 2.00 months with 43 listings, averaging $498,340 and a median of $468,888. Homes move in 30 days, and 48.8% drop by only $21,000, showing sellers still hold the reins. Or check 78736, southwest of downtown, with an MOI of 2.36 months, 26 listings, and an average price of $1,533,907—42.3% of homes drop by $42,000 after 58 days, but it’s still a seller’s game.
Price changes add more detail. In 78701, just 1.3% of listings went up by $25,000, while 60.3% held steady. In 78704, only 0.5% rose by $105,000, with 58% unchanged. In 78746, 1.5% increased by $29,000, but the big drops dominate. Beyond Austin, 78669 saw 2% of listings rise by $37,000 with 53.4% steady, and 78645 had 2.2% go up by $51,000 with 45.2% unchanged. These stats show sellers in buyers’ markets are more likely to lower prices, while sellers’ markets see smaller tweaks. For instance, in 78717 (3.50 MOI, $671,560 average), 42.9% dropped $32,000, and in 78725 (2.75 MOI, $337,648 average), 42.4% dropped $23,000—still competitive areas despite the cuts.
This data proves Austin’s 2025 market isn’t uniform. Zip codes like 78701, 78704, 78746, 78702, and 78741, all with MOI over 7, say yes to a buyers’ market, with high inventory and notable price drops. But spots like 78727 (2.00 MOI), 78736 (2.36 MOI), and 78749 (3.04 MOI, $618,826 average, 50.6% dropping $33,000) scream sellers’ market, with homes selling fast and fewer concessions. The Austin area’s average MOI of 6.04 months sits in the middle, but these extremes show why zip codes matter. Whether you’re buying or selling, this April 2025 snapshot highlights how knowing your specific area—from downtown’s 78701 to Spicewood’s 78669—could be the key to your next move.
Q1: Is Austin a buyers’ market in 2025?
A: It varies by zip code. The April 2025 Team Price Real Estate data shows an average MOI of 6.04 months across 75 Austin-area zip codes, near neutral but leaning toward buyers. Within Austin, 78701 (11.00 months) and 78704 (10.63 months) are buyers’ markets, while 78727 (2.00 months) and 78736 (2.36 months) favor sellers.
Q2: Which Austin zip codes are best for buyers in 2025?
A: Zip codes with over 7 months of inventory shine for buyers. In April 2025, top picks include 78701 (11.00 MOI, $1,185,773 average), 78704 (10.63 MOI, $1,290,606 average), 78746 (9.43 MOI, $3,336,813 average), 78702 (8.39 MOI, $842,418 average), and 78741 (11.00 MOI, $571,587 average), with drops like $405,000 in 78746.
Q3: How do I know if a zip code is a buyers’ market?
A: Look at Months of Inventory (MOI). The April 2025 data marks buyers’ markets as over 7 months. For example, 78701 has 11.00 months with 38.4% of listings dropping $136,000, while 78727’s 2.00 months and 48.8% dropping $21,000 show a sellers’ market. High MOI and price cuts mean buyer advantage.
Request Info
Have a question about this article or want to learn more?
