

Austin Real Estate Market Correction: March 2025 Data Breakdown
Published | Posted by Dan Price
March 2025 Austin Real Estate Market: Sales Drop Signals Correction
The real estate market in Austin and its surrounding areas has always been a hot topic, and the latest data from March 2025 offers a clear look at what’s happening. According to a detailed report from Team Price Real Estate, revised on April 6, 2025, a total of 2,479 properties were sold across the region that month. This number comes from a comprehensive dataset tracking sales density over 25 years, showing how the market ebbs and flows. Compared to the historical March average of 2,368 properties since 2000, this year’s figure is up by 4.7%. However, it’s slightly below the historical median of 2,431 by 2%, hinting at a shift that’s worth digging into.
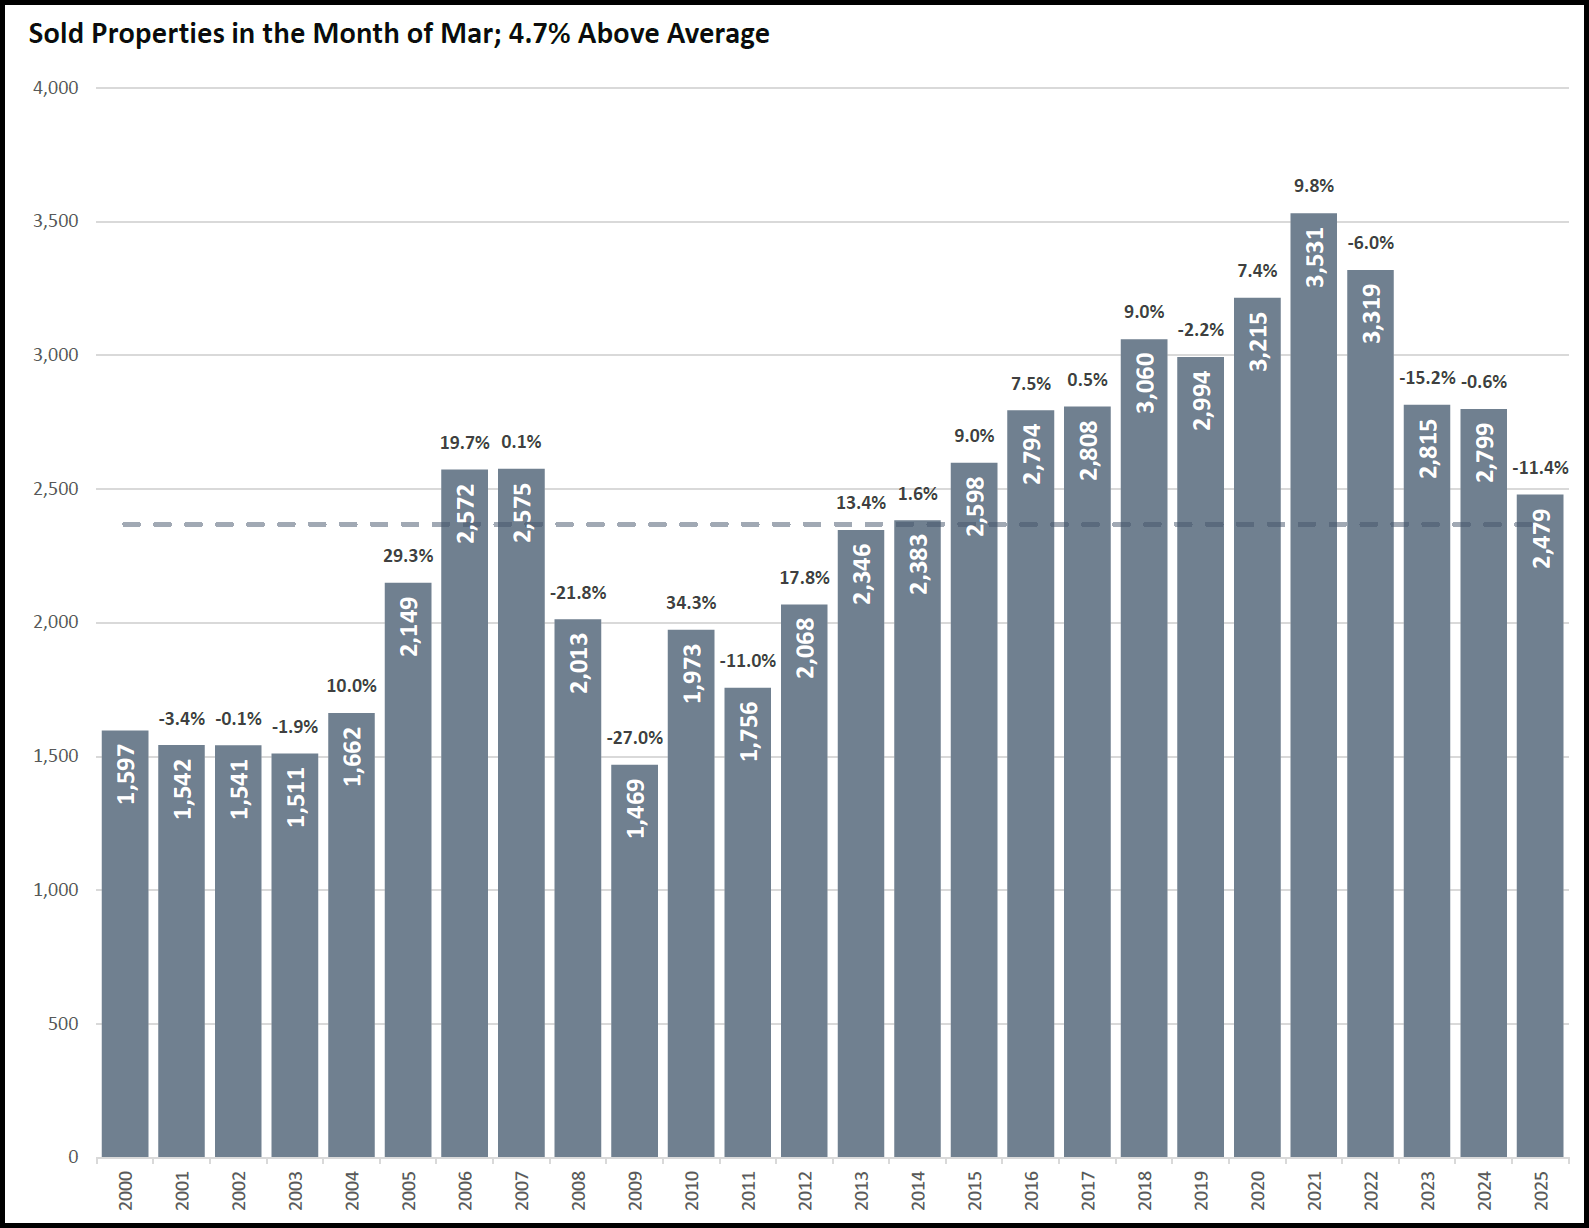
Breaking it down further, the report provides sales figures for 30 specific cities in the Austin region, totaling 2,380 properties sold in March 2025. Austin itself led the pack with 836 sales, making up over a third of the total. Georgetown followed with 242 sales, while smaller towns like Dale saw just 1 sale. This spread shows a market that’s heavily centered around big players like Austin, but it also reveals a bigger story when you look at the year-over-year numbers. From March 2024, when 2,799 properties were sold, to March 2025’s 2,479, there’s an 11.4% drop. This decline suggests a market correction might be underway, raising questions about why sales are going down.
Zooming in even more, the report lists sales for 75 zip codes, adding up to 2,449 properties in March 2025. Zip code 78628 in Georgetown topped the list with 121 sales, while 78745 in Austin recorded 67. On the low end, zip code 78616 in Dale had just 1 sale. This zip code data aligns closely with the aggregate total of 2,479, differing by only 30 sales, or 1.2%. The city-specific total of 2,380 is 99 sales shy of the aggregate, a 4% gap that likely includes rural areas or smaller towns not listed. Across these zip codes, the average sales per area was 32.65, with a median of 23, showing a wide range from 1 to 121. This variability underscores how uneven the market correction is playing out.
Looking at trends over time, the data paints a picture of a market that’s cooling off. That 11.4% drop from March 2024 to March 2025 is a big signal. In the city-specific data, 70% of the 30 cities—21 in total—saw fewer sales compared to the previous year. For example, Dale’s sales plummeted by 83%, from 6 to 1, while Del Valle jumped 190%, from 10 to 29. The average year-over-year change across these cities was a slight decline of 0.9%, but the majority trending downward aligns with the broader 11.4% drop. In the zip code data, 60% of the 75 areas—45 zip codes—also reported lower sales, with declines ranging from 4% in Hutto’s 78634 (97 to 93) to that same 83% in Dale’s 78616. Only 36% of zip codes saw gains, like Bertram’s 78605, which rose 200% from 5 to 15.
So, why are sales going down in the Austin real estate market? The data doesn’t give a direct answer, but it offers clues. One factor could be the contrast with the previous month. From February 2025’s 1,931 sales to March 2025’s 2,479, there’s a 28.4% increase—a seasonal spike that’s typical for spring. Historically, March sales often jump from February, but this year’s 2,479 is still below the peak years like 2020, when 3,215 properties sold, or 2021’s 3,531. This suggests the market might be correcting from those high points, settling into a lower baseline. In the city data, Austin’s 836 sales are robust, but smaller towns like Marble Falls (8 sales) and Smithville (7 sales) show weaker activity, possibly reflecting broader economic pressures or shifts in buyer interest.
The Austin real estate market’s correction isn’t uniform. In the city-specific numbers, the standard deviation—a measure of how spread out the data is—comes in at 240, driven by Austin’s massive 836 sales against tiny figures like Dale’s 1. In the zip code data, the standard deviation is 32, with sales ranging from 1 to 121. This tighter spread suggests that while some areas are holding steady, others are feeling the downturn more sharply. For instance, Kyle’s zip code 78640 sold 109 properties, down 28% from 152 in March 2024, while Round Rock’s 78665 dropped 38% from 95 to 59. These declines hint at local factors, like inventory levels or pricing, that could be pushing sales lower.
Drilling into the numbers, the average sales per city in March 2025 was 79.33, with a median of 60, meaning half the cities sold 60 or fewer properties. Georgetown’s 242 and Leander’s 113 stand out as strong performers, but 70% of cities losing ground year-over-year points to a widespread slowdown. The zip code data tells a similar story: an average of 32.65 sales per area, with a median of 23, and 16 being the most common number, appearing in five zip codes like 78705 and 78634. With 60% of zip codes down, the correction seems to hit harder in smaller or less central areas, while Austin and Georgetown hold more resilience.
The question of market correction ties back to that 11.4% drop from March 2024. It’s a significant shift, especially after years of growth. In 2020, sales soared to 3,215, and in 2021, they hit 3,531—numbers that dwarf 2025’s 2,479. This decline could reflect a return to pre-pandemic norms, as the historical average of 2,368 shows March 2025 isn’t far off the long-term trend. Still, the drop from 2,799 to 2,479 in just one year is steep, and with 70% of cities and 60% of zip codes trending down, it’s clear the Austin real estate market is adjusting. Whether it’s due to higher interest rates, fewer buyers, or an oversupply of homes, the data signals a correction that’s reshaping the region’s housing landscape.
Q1: Is the Austin real estate market crashing in 2025?
A: The data from March 2025 doesn’t indicate a crash. Total sales reached 2,479 properties, down 11.4% from 2,799 in March 2024, but still 4.7% above the historical average of 2,368. This suggests a correction, not a collapse, as sales remain above long-term norms despite the decline.
Q2: Why are home sales declining in Austin in 2025?
A: The March 2025 data shows a 11.4% drop from the previous year, with 70% of 30 cities and 60% of 75 zip codes reporting lower sales. While the report doesn’t specify causes, the decline from 2024’s 2,799 to 2,479 could stem from factors like rising interest rates, reduced buyer demand, or an adjustment after peak years like 2020 (3,215 sales) and 2021 (3,531 sales).
Q3: Which areas in Austin saw the biggest sales drops in March 2025?
A: In the city data, Dale had the steepest decline, falling 83% from 6 to 1 sale. In the zip code data, 78616 (Dale) also dropped 83%, from 6 to 1. Other notable declines include Manor’s 78653 (down 47% from 90 to 48) and Round Rock’s 78665 (down 38% from 95 to 59), showing the correction’s uneven impact.
Request Info
Have a question about this article or want to learn more?
