

Austin Housing Market: New Listing to Pending Ratio Trends (2000–2025)
Published | Posted by Dan Price
Understanding the Austin Housing Market with the New Listing to Pending Ratio : The New Listing to Pending Ratio is a valuable metric for understanding how well the housing market is absorbing new inventory. This ratio is calculated by dividing the number of new and back-on-market listings by the number of properties that go under contract, including those marked active under contract or pending. A ratio of 1.0 represents perfect balance, meaning the number of homes entering the market equals the number of homes going under contract. When the ratio falls below 1.0, it indicates that more homes are being listed than sold, causing inventory to rise. A ratio above 1.0 signals that demand is outpacing supply, which often leads to tighter inventory and upward pressure on prices.
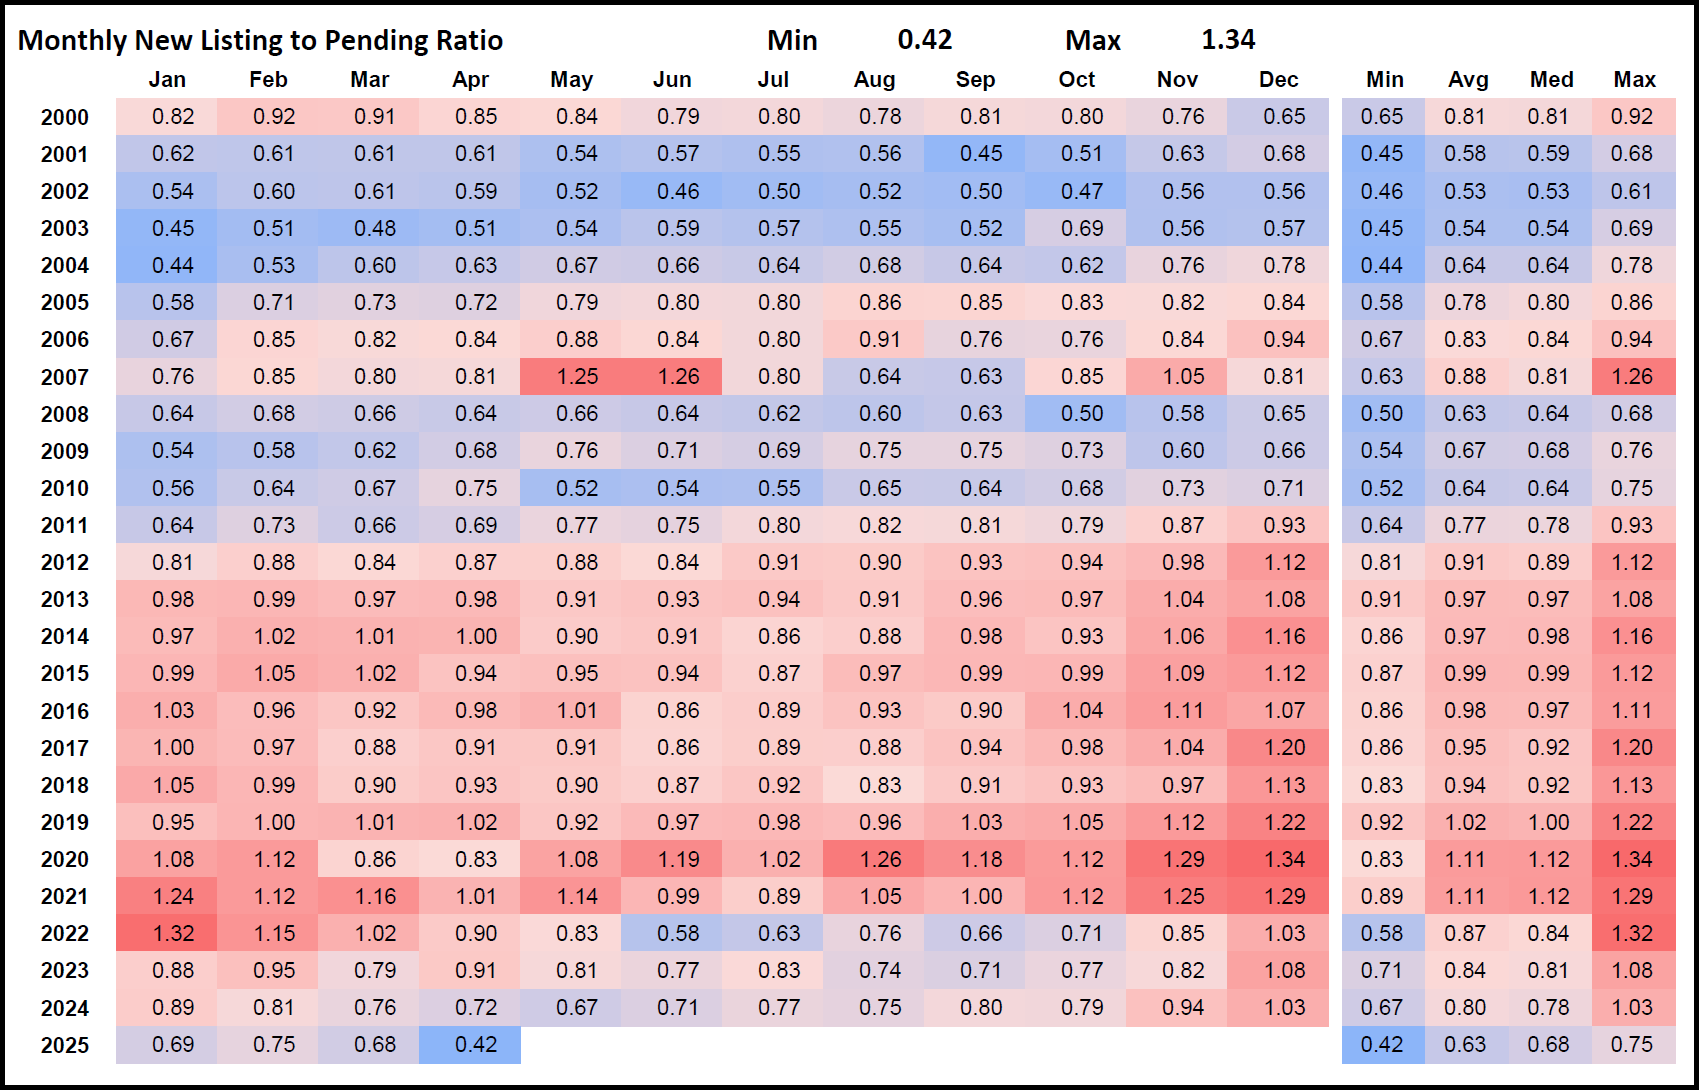
From 2000 to 2011, Austin’s housing market mostly operated below this equilibrium. In 2001, the average annual ratio was just 0.58, with some months falling as low as 0.45. Between 2008 and 2011, the ratio remained in the 0.63 to 0.77 range, reflecting sluggish demand during the post-recession recovery. However, as the market stabilized, the ratio began to climb. By 2012, the annual average reached 0.91, and in the years that followed, it regularly exceeded the 1.0 benchmark. Between 2013 and 2021, the market was highly competitive, with annual averages ranging from 0.94 to as high as 1.12, including a peak monthly ratio of 1.34 in December 2020. These numbers reflected a seller’s market driven by low interest rates and rising buyer demand.
The shift began in 2022. Although the year started strong with a January ratio of 1.32, the market slowed quickly. By June 2022, the ratio dropped to 0.58, and the annual average fell to 0.87. The trend continued into 2023, with a further decline in market absorption. The average monthly ratio in 2023 was 0.84, suggesting a more balanced—but still softening—market. This trend persisted into 2024, with the average falling again to 0.80, and monthly ratios often hovering in the 0.70 range.
So far in 2025, the absorption rate has declined significantly. The ratio fell to 0.68 in March and dropped further to 0.42 in April, matching the lowest monthly ratio observed in over two decades. This shift is a key signal: more homes are being listed than are going under contract. When this pattern continues over time, it typically leads to an increase in inventory levels, longer days on market, and greater pricing pressure on sellers. Historically, a sustained ratio under 0.5 indicates a very soft absorption market, which could signal growing supply and decreasing urgency among buyers.
This ratio is not only a reflection of market behavior but also a forward-looking indicator. Rising ratios signal stronger demand and potential price growth. Falling ratios indicate that the market is cooling, and inventory may begin to rise. By consistently monitoring this ratio, real estate professionals and clients alike can gain valuable insight into the current market cycle and anticipate how conditions may change in the months ahead.
What is the New Listing to Pending Ratio in real estate?
The New Listing to Pending Ratio measures how many new listings are entering the market compared to how many homes go under contract. A ratio of 1.0 suggests a balanced market where every new listing is met by a sale.
Why does a low New Listing to Pending Ratio matter?
A low ratio means that more homes are being listed than are selling, which increases inventory and may signal a slowing market. It can lead to longer days on market and potential price reductions.
What is a good New Listing to Pending Ratio for a balanced market?
A ratio close to 1.0 indicates balance. When it drops below 0.8, it suggests weakening demand. A ratio under 0.5 generally signals a very soft market with growing inventory levels.
Request Info
Have a question about this article or want to learn more?
